
Two months ago we released ECSY, a framework-agnostic Entity Component System library you could use to build real time applications with the engine of your choice.
Today we are happy to announce a developer tools extension for ECSY, aiming to help you better understand what it is going on in your application when using ECSY.
A common requirement when building applications that require high performance- such as real time 3D graphics, AR and VR experiences- is the need to understand which part of our application is consuming more resources. We could always use the browsers’ profilers to try to understand our bottlenecks but they can be a bit unintuitive to use, and it is hard to get an overview of what is going on in the entire application, rather than focusing on a specific piece of your code.
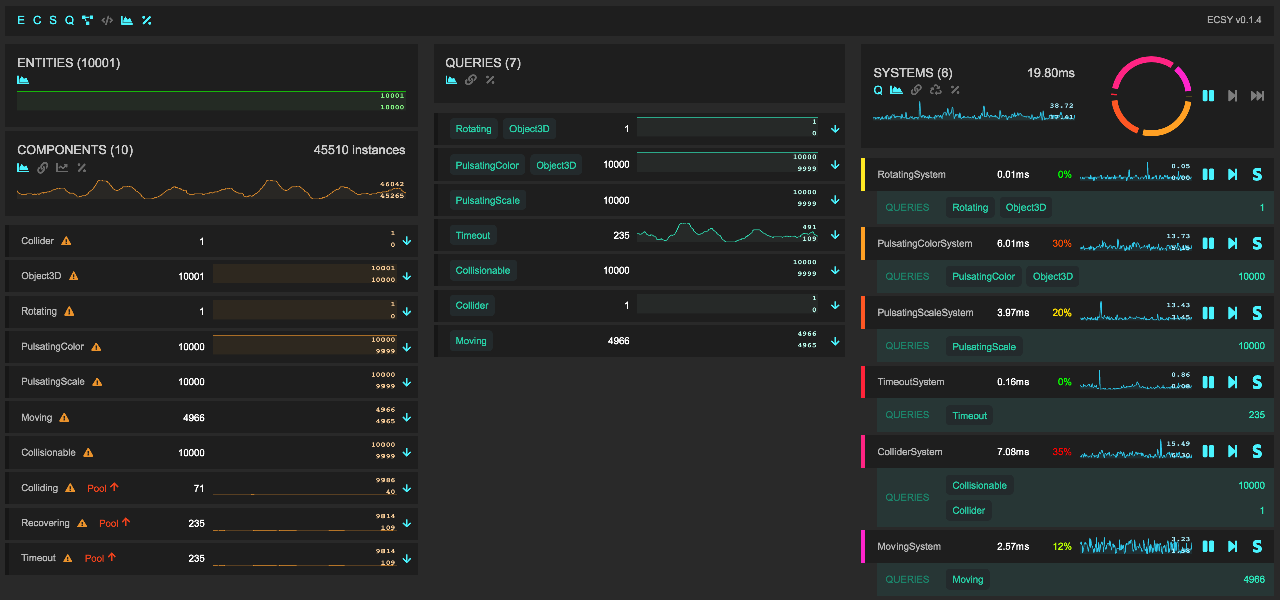
With the ECSY developer tools extension you can now see that overview, getting statistics in realtime on how your systems are performing. Once you know which system is causing troubles in performance you can then use the browser profiler to dig into the underlying issue.
Apart from showing the status of the application, the extension lets you control the execution (eg: play/pause, step system, step frame) for debugging or learning purposes, as well as accessing the value of the queries and components used in your application.
How do I use it?
-
Install the extension from the extension store for your browser (Firefox, Chrome)
-
Launch any ECSY application (For example the circle-boxes example). You will notice that the “ECSY” icon on the toolbar changes its color indicating that the ECSY library is detected:
![]()
- Open the
ECSYtab in the browser’s developer tool (Firefox, Chrome) and you will see the state of the application.
Panel overview
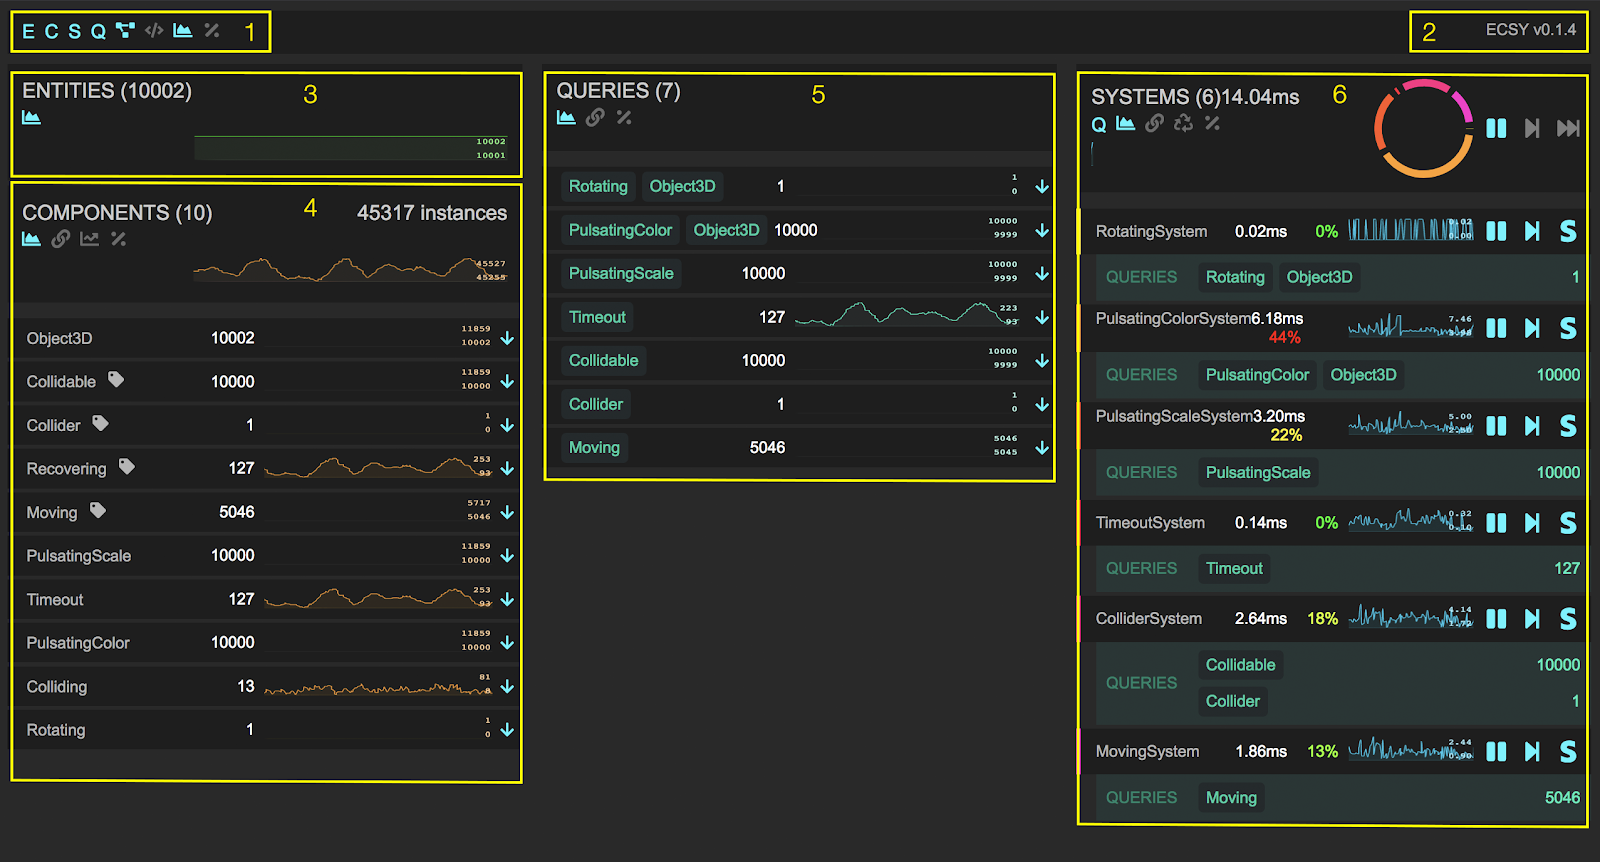
When the ECSY extension panel is loaded, you will see all the sections available on the UI. (A big shout out to the flecs team as their work on their admin panel was a big inspiration for us when designing the UI)
- (1) Main toolbar: You can control options that affect all the main panels. The buttons in order are:
- Entities (E), Components (C), Queries (Q) and Systems (S): the buttons will toggle the visibility for each of the main panels.
- Show relationship between components: When enabled it will highlight the relationships between Components, Queries and Systems. Eg: If you hover the
Rotatingcomponent, it will highlight theRotatingquery as it is using that component, as well as theRotatingSystem. - Show debug: Show the JSON with all the stats and info collected from the ECSY application used by the extension.
- Show remote console (If debugging a remote device): It lets you enter commands to be executed on the remote device.
- Show Graphs: Toggle the graphs on all the sections.
- Show Stats: Toggle detailed stats on all the sections. This includes the following computed values for each entry:
- Minimum
- Maximum
- Mean
- Standard deviation
- (2) Version info: Shows the version info as well as the connection details if connected to a remote device.
- (3) Entities: The number of entities created.
- (4) Components: Shows the number of component classes and their instances in the application.
- This section also includes a toolbar similar to the main one:
- Show graphs and stats: For all the components
- Link minimum and maximum values: It will synchronize all the graphs with the maximum and minimum globals values.
- Show pool size: It will include on each component’s graph another time series with the size of the pool for that component in red color.
- Show detailed stats: minimum, maximum, average and standard deviation.
- Then each component you can see:
- Tag components: They will include a special icon to easily spot them on the list.
- Pool detection:
- If the component is not using a pool, it will show a warning icon indicating that it is recommended to define them as poolable for performance reasons.
- Every time the application is creating a new component, you will see a flash message indicating if it has no pool, or the pool has no empty elements on it.
- Dump to console: Each component has an arrow icon that will dump the list of instances of that component to the console. That list will also be assigned to a variable called
$componentso you can use it on the console.
- This section also includes a toolbar similar to the main one:
- (5) Queries: Similar to the components section, here you also have a toolbar to toggle the graph and stats visibility or toggle the graphs’ minimum and maximum values synchronization. For each query you can see the components that take part in its definition and the number of entities the query has.
- (6) Systems: In this section you can explore all the systems being executed in your application loop and the timing for all of them.
Each system shows the number of milliseconds it took to execute in the last frame, and the percentage of that time related to the whole frame time. For each query on the system you will also get extra stats if they are “reactive” (link ecsy), indicating the size of the queues for each event (added, removed or changed).
We can control the execution for debugging or learning purposes:
- World: Applied to all systems:
- Play/Stop: Play or stop all the systems
- Step one frame: Execute all the systems one time
- Step next system: Execute the next system in order. Just one system at a time.
- System
- Play/Stop: Play or stop the specific system
- Step: Execute the system one time.
- Solo: Pauses all the other systems but this one. Clicking on it again will undo the action.
- World: Applied to all systems:
Remote connection
When debugging applications sometimes we want to test our code on an external device like a mobile phone or a standalone VR headset. The problem is that custom WebExtensions are not available when connecting to remote devices from the browser’s developer tools.
To address this issue we implemented a custom remote protocol using WebSockets and WebRTC, so you can connect to your device even if it is not connected via USB to your laptop, or using the same browser as you are using for debugging (eg: you could use Chrome to connect to a Firefox Reality browser on a VR device or Firefox to connect to an Oculus Browser sessions).
How to enable the developer tools remote connection in an ECSY application?
Today we also release a new version of ECSY (v.0.2) that includes support for using the developer tools with remote devices.
Remote connection can be enabled using two methods:
-
Explicitly calling
enableRemoteDevtools()on your application.import {enableRemoteDevtools} from “ecsy”;
enableRemoteDevtools( /* optional Code */);Please notice that you can pass an optional parameter as the code that the application will be listening for. Otherwise, a new one will be generated:
-
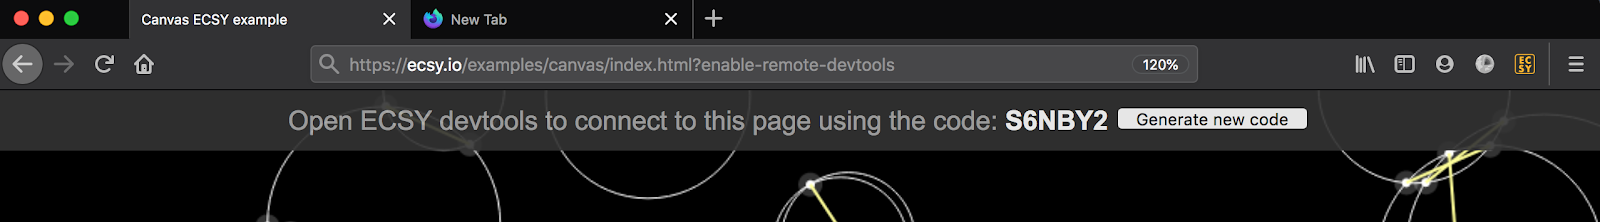
Adding
?enable-remote-devtoolsto the URL when running your application on the browser you want to connect to. Using any of the previous methods will add an overlay on your application showing a random code that will be used to connect to remotely.
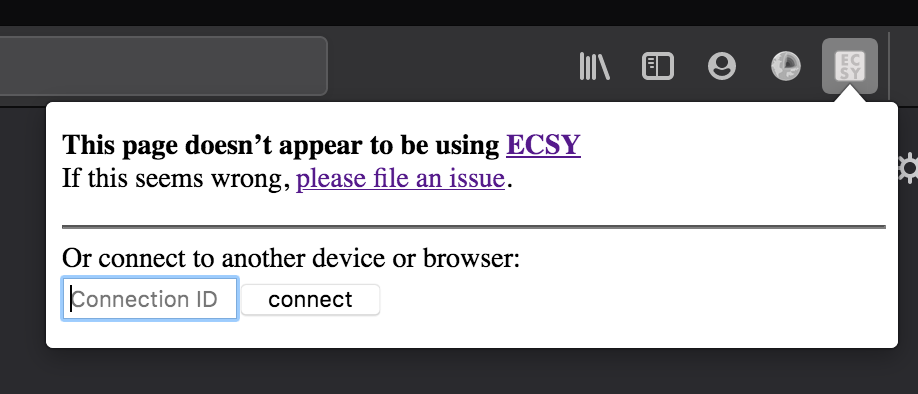
How to connect a remote device?
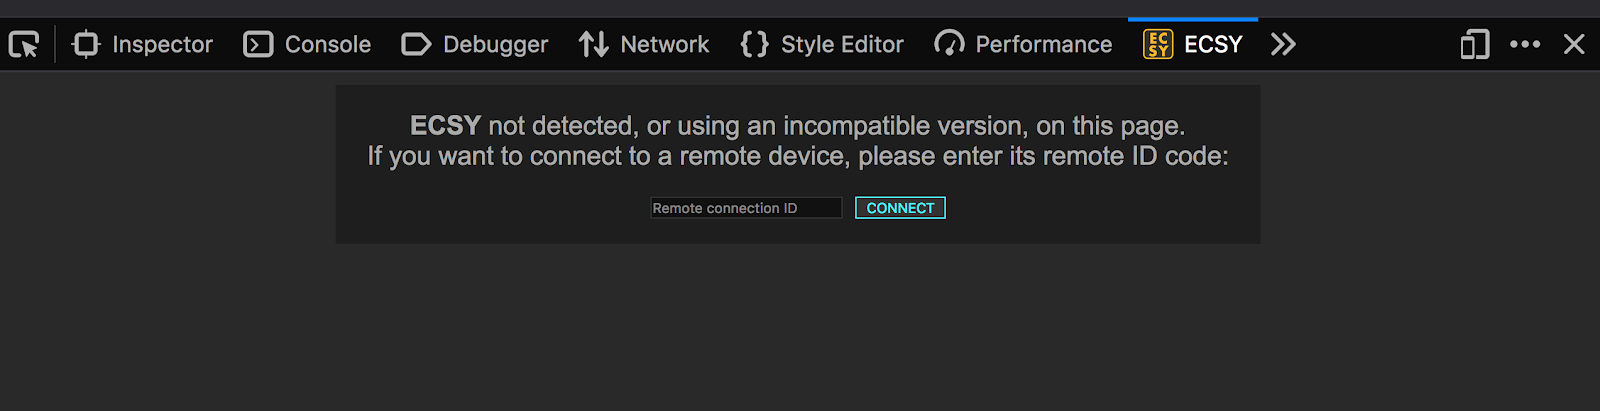
Once we get the code from the previous section, we can connect to that device from our preferred browser by clicking the ECSY icon on the extensions toolbar, entering the code and clicking connect:
Or doing the same from the ECSY panel in the developer tools.
Features on remote devices
When using the developer tools on a remote device there are some differences from running it locally.
Console.log and errors hooks
We hook every call to console.* as well as any error thrown by the application running on the remote device, we will send them back to the host developer tools browser and log them on the console.
Dump to console
When connected to a remote device you still have the dump to console functionality to inspect components and queries, but it works slightly differently: The remote device will serialize the data and send it to the host developer tools that will deserialize it again and call console.log with that.
Note that currently the deserialization process is quite simple, so we are just preserving the raw data, but we lose all functions and data type definitions.
Remote console
We also included the ability to execute code on the remote device. Clicking on the remote console icon, the following panel will appear:
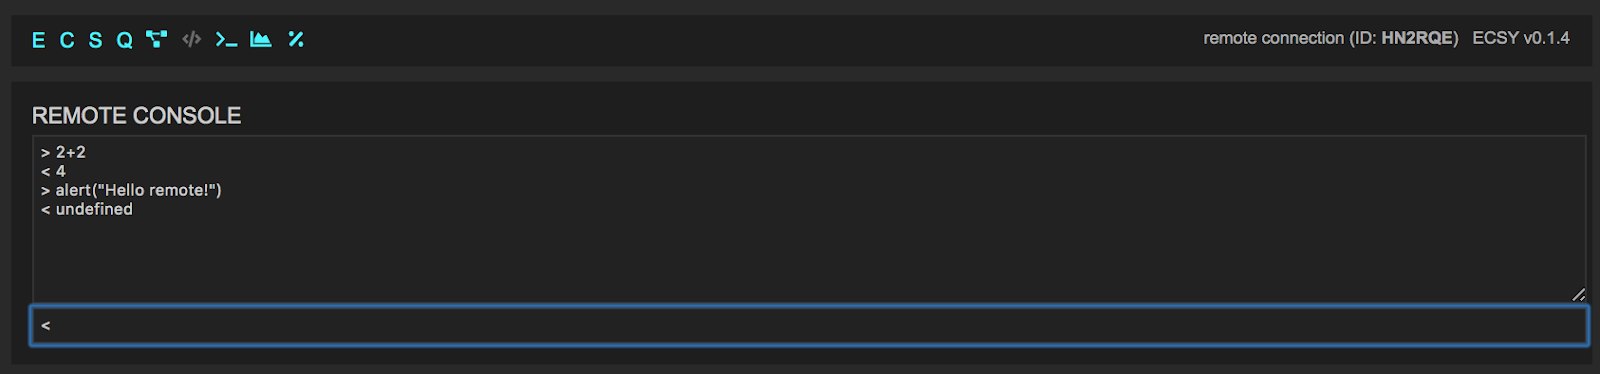
Everything you enter on the textbox will get executed on the remote device and it will write the result of the evaluation on the list above.
What’s next?
Currently, the extension is still experimental and we still have to fix issues on the current implementation (eg: right now there is a lot of re-render going on on the react UI making it slow on applications with many components and systems), and many other cool features we would like to include on the incoming version.
We would love your feedback! Please join us on Discourse or Github to discuss what you do think and share your needs.