
I've always been fascinating by machine learning from data. I was reading about self-organizing map (SOM) and I wanted to try to implement a little program about it.
The program is based on the Kohonen maps, you create a NxM grid of neurons and trains it with a input data set. The learning process consists on find the similarities between input data and stored data from the map. After a while it will group the inputs with similar attributes together.
Implementation
The program takes a CSV file as input based on numeric attributes and generate a graphical output. The workflow is quite simple as you can see in the following picture:
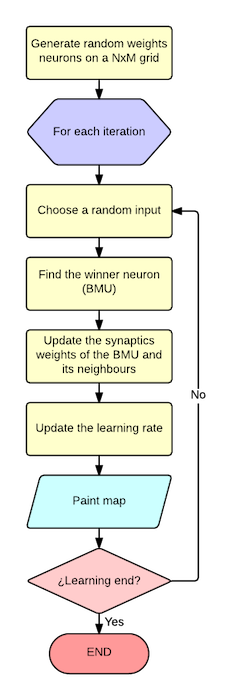
- Generate a NxM matrix filled with random weights for each neuron ij
- For each iteration:
- Select a random input from the inputs set
- Find the winner neuron (Best matching unit - BMU) that minimize the distance to the input
- Update the weights for the winner and the neigbours neurons based on the ratio and influence parameter.
- Update the learning ratio
Input data file
Data inputs come form a CSV separated by semicolon (;) where the first row is the description of the column attribute and each row is one input to the network. By default, it takes the last column as class attribute.
The following example is from the iris data set using in the video simulation:
Sepal length;Sepal width;Petal length;Petal width;Specie
5.1;3.5;1.4;0.2;0
4.9;3.0;1.4;0.2;0
4.7;3.2;1.3;0.2;0
4.6;3.1;1.5;0.2;0
...
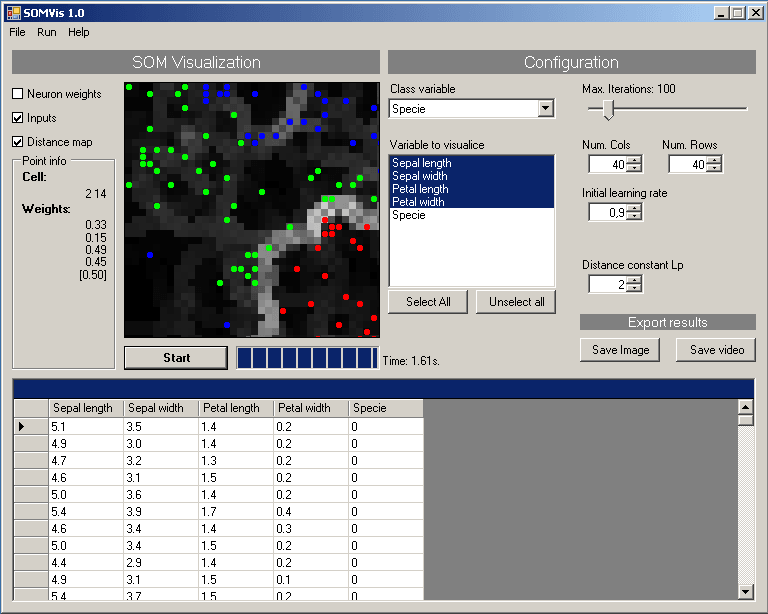
User interface
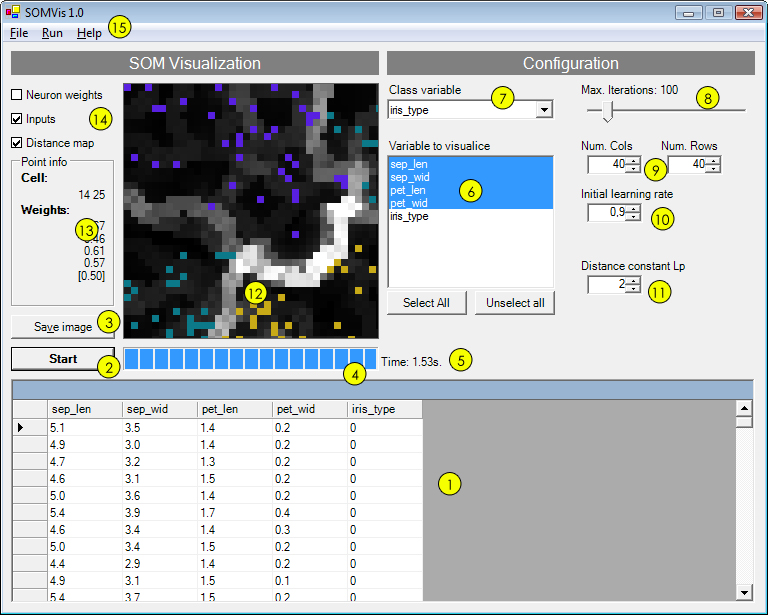
- Input table: Values read from the CSV.
- Start button: Star the learning process. Once it start it will change for Stop.
- Save image: Save the actual image in PNG format.
- Progress bar: Shows the learning progress until reach the maximum number of iterations.
- Current execution time
- Variables to visualize
- Class variable: The classification variable.
- Number of iterations: Number of iterations used to learn the network.
- Numbers of rows and columns: Network dimension.
- Initial learning rate
- Lp constant: Used to compute the distance between neurons
- SOM Map Bidimensional representation of the map.
- Current cell info: Show the weight and the class of the current cell.
- Representation mode: Show inputs, distance matrix or neuron's weights.
- Main menu
Here you can see the basic usage of the SOMVIS program:
- Load a CSV dataset
- Select the class variable. By default it will choose the last parameter.
- Set the learning rate parameters
- Click run and see how the SOM works
Learning example
The following video shows a SOM generated from the iris flower data set: